June 2024
June 24, 2024

Welcome to the latest edition of our client newsletter,
Our articles cover a range of topics which we hope you will find interesting. We aim to keep you informed of changes as they happen, but we also want to provide ideas to help you live the life you want – now and in the future.
In this edition we discuss “Setting yourself up for success in the new Financial year” and provide you with information on “The Australian intergenerational wealth divide” and “The 2024-2025 Budget”.
If you would like to discuss any of the issues raised in this newsletter, please don’t hesitate to contact us.
In the meantime we hope you enjoy the read.
All the best,
Planet Wealth

Setting yourself up for success in the new financial year
The start of a new financial year is the perfect time to get your financial affairs in order. Whether it’s tidying up your paperwork, assessing your portfolio or dealing with outstanding issues, there are plenty of practical actions you can take.
Here are some strategies for starting the new financial year on the right foot.
Tidy up your paperwork
Dealing with the paperwork is the task most of us love to hate. But taking a day to trawl through the ‘To Do’ pile and the growing mountain of filing could be a good investment in yourself. What’s more, you might identify some savings.
Set your budget
A lot can happen in a year, so it makes sense to review your budget to ensure it still works towards your goals in the new year. This will help you track your changing expenses and ensure you’re not overspending. And if you haven’t got a working budget, now’s a great time to start. There are plenty of budgeting apps and tools available online that can help you get started.
Assess your portfolio
Another important step to take as you start the new financial year is to assess your investment portfolio.
Some important questions include:
- Why did you start investing and have your circumstances changed? For example, you may have started investing to receive a better return than your term deposits but now that term deposits rates have increased and share markets are challenged, should you revisit that goal?
- What is the investment performance? Is it in line with your expectation and the benchmark?
- Should you consider diversifying into different asset classes?
- Is dividend reinvestment the best option for you or should you take the dividend income into cash?
- Is your risk appetite still the same, or should you be aggressive or more conservative?
Check your insurance
Now is a good time to examine your insurances closely and to consider whether they match your needs and risks. It is also a good reminder to take note of policy renewal dates so that you can shop around to make sure you get the best price.
Understand Federal Budget changes
Keeping up to date with the commentary about Federal Budget initiatives may be useful.
The measures aimed at easing the cost of living will provide a boost to some, which includes the government’s energy bill rebate and Stage 3 tax relief.
Review your superannuation
A review – at least annually – of your super account is vital to make sure that:
- Your investments and risk strategy are still right for you
- The fees are reasonable
- Any insurance policies held in your super account are appropriate
- Your employer contributions are being made
- Your death benefit nomination is relevant
- You don’t have multiple accounts incurring unnecessary fees
You might also consider a salary sacrifice strategy, where you ask your employer to make extra super contributions from your pre-tax salary. These additional contributions are taxed at 15 per cent within the super fund, plus an additional 15% if Division 293 tax applies to you (income over $250,000).
Meanwhile, it is not too late to top up your super balance for this financial year using either concessional contributions (from your pre-tax income) or non-concessional contributions (after-tax income). Don’t forget the caps on payments, which from 1 July will now be $30,000 for concessional contributions and $120,000 for non-concessional.
It is a good idea to get some expert advice regarding your super contributions, we can assist with the best ways to manage your contributions.
So, set yourself up for a fresh start to the year with some simple strategies to help you achieve your financial goals.
Current as at June 2024

The Australian intergenerational wealth divide
AMP Deputy Chief Economist Diana Mousina looks at the issues that have led to the increasing wealth divide between older and younger Australians
Comparing wealth inequality has long been a popular debate in Australia, from popular slogans like “OK Boomer” to generalisations about the “smashed avo eating” millennial and Gen Z generations.
Around 70% of household wealth1 is tied to the value of our homes. In the short term, changes in household wealth can have implications for savings and spending. And in the long term, household wealth can affect retirement savings, reliance on the aged pension and living standards.
The wealth debate has extended into the impact of recent interest rate hikes.
First, let’s look at how higher rates have had different impacts on Australian households.
Winners and losers
Interest rate changes always affect households with a mortgage the most and 30% of Australian households have a mortgage.
Younger households are more likely to have taken out large mortgages in recent years at low rates, which now need to be serviced at higher rates, eating into their disposable income.
Older households’ disposable income hasn’t been hit as much because they tend to have less debt and can draw down on their savings to fund spending.
The chart below shows savings for younger households have fallen and spending growth has also been low. This reflects the fall in disposable income for younger households paying off mortgages as interest rates rise.
Meanwhile, older households have been increasing their savings and spending, with higher rates meaning higher savings rates.
Spending and Saving across Households
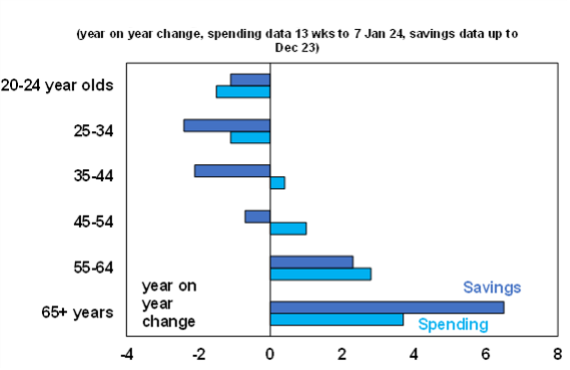
Source: CBA, AMP
Older generations understand the different conditions their children and grandchildren are facing. Recent AMP research showed 80% of Australians aged 65 and over believe their children face similar or harder financial challenges than they did.
Household income and wealth through time
To understand the current spending and savings habits of different generations, it’s useful to take a step back and look at the backdrop of income and wealth across different household age groups.
The chart below looks at household income. Gen X incomes started exceeding Baby Boomers from 2008, as they entered the peak point of their career and experienced higher incomes. Millennial incomes now also exceed Boomers and will exceed Gen X in under a decade when Millennials reach middle age.
Australia average household income by generation
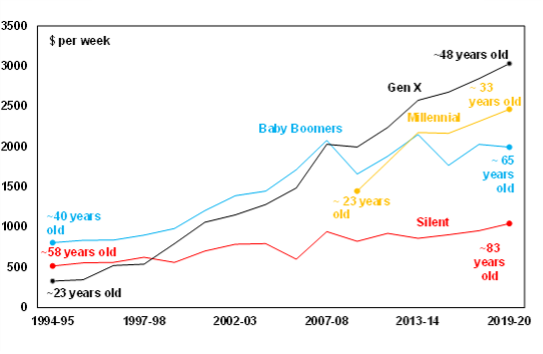
Source: ABS, AMP
The next chart looks at household net worth. Each generation has enjoyed an increase in wealth over time. But the growth in Boomers’ wealth has been higher than other generations, which has increased the wealth gap.
Average Net Worth of Households By Generation
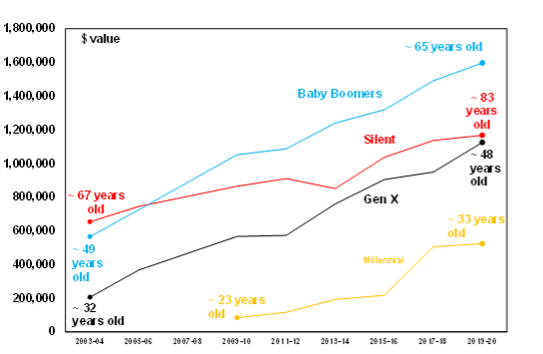
Source: ABS, AMP
So why have Boomers done so well? It’s really been down to good luck in asset prices, driven by the 40-year decline in interest rates that has lifted shares and home prices.
- Home prices have grown around 8% over the last 30 years – it used to take 6 years to save for a 20% deposit while now it takes nearly 11 years.
- Australian share prices have increased by over 9% over the same period.
- The superannuation guarantee has increased from 9% in the early 2000s to 11.5% this year, which is a form of forced saving.
The favourable treatment of housing as an asset (through the capital gains tax discount, negative gearing and exclusion of the family home from the aged pension test) has also helped to lift home prices, as has the chronic undersupply of housing in Australia.
But it’s not all doom and gloom…
Younger Australians are entering the labour market when conditions are tight, which should mean easier access to work although youth unemployment has been rising. Flexible work means more job opportunities. And high wages growth also means that starting incomes for young people are attractive.
The younger generation also seems to be taking on riskier investments, reflecting the more secure economic environment they’ve grown up in. Gen Z are much more likely to hold cryptocurrencies, international shares and exchange traded funds. This allows for large potential upside but also more downside if things go wrong.
The solution to the wealth divide? Make housing more affordable
The increasing divide in wealth between older and younger households is difficult to address because it mostly involves good luck for Boomers which can’t be undone. But what can be solved by policy is addressing housing affordability by increasing supply.
Improving housing supply can be done through:
- encouraging older households to downsize
- releasing more land
- speeding up approvals
- encouraging growth in regional centres
- investing in regional infrastructure.
Call us for a chat
Whatever stage of life you’re at – working or retired, Millennial or Boomer – we can help you make the most of your money.
This article has been written by Diana Mousina, Deputy Chief Economist at AMP.
Current as at June 2024
Important note: While every care has been taken in the preparation of this document, neither National Mutual Funds Management Ltd (ABN 32 006 787 720, AFSL 234652) (NMFM), AMP Limited ABN 49 079 354 519 nor any other member of the AMP Group (AMP) makes any representations or warranties as to the accuracy or completeness of any statement in it including, without limitation, any forecasts. Past performance is not a reliable indicator of future performance. This document has been prepared for the purpose of providing general information, without taking account of any particular investor’s objectives, financial situation or needs. An investor should, before making any investment decisions, consider the appropriateness of the information in this document, and seek professional advice, having regard to the investor’s objectives, financial situation and needs. This document is solely for the use of the party to whom it is provided. This document is not intended for distribution or use in any jurisdiction where it would be contrary to applicable laws, regulations or directives and does not constitute a recommendation, offer, solicitation or invitation to invest.
1 The conflicting priorities facing retirees and the ‘never leave home’ generations (amp.com.au)

Another surplus, but bigger medium term deficits with more big spending, including on a “Future Made in Australia”
Key points
– The budget this year is expected to show a surplus of $9.3bn thanks to a continuing revenue windfall, but slip back into bigger deficits from 2024-25.
– Key measures include broader cost-of-living support & “Future Made in Australia” measures.
– Significant extra spending risks adding to inflation.
– Structural budget deficits remain in the medium term as the revenue windfall fades and spending remains high. Bigger government looks increasingly locked in.
Introduction
The Budget is aimed at trying to lower inflation in the near term but supporting Government priorities including formally launching a “Future Made in Australia” (FMIA) over the medium term. In terms of the former, there is another round of cost-of-living subsidies designed to reduce measured inflation. In terms of the latter, it further cements bigger government and sees bigger deficits for the medium term.
Key budget measures
Key measures, many of which were announced prior, include:
- $5.4bn in a broader round of cost-of-living relief, including broadening energy bill relief for all households and extending rent assistance.
- A renewed focus on the benefits to all households from the Stage 3 tax cuts that were rejigged in January (worth an average of $36/wk).
- $3bn for community pharmacies for cheaper medication and $6.2bn on Medicare and expanding the Pharmaceutical Benefits Scheme.
- $9.6bn on housing & crisis accommodation and extra on related infrastructure (although much is a continuation of existing programs) and $89m to train home builders (although the planned 20,000 new tradies are only 1.7% of the existing construction workforce).
- Prac payments for nurses, midwives and social workers.
- A change to student debt indexation which cuts the value of debt with no near-term budget cost as it won’t involve a handout to students.
- A mix of subsidies, tax breaks, cheap loans, relaxed foreign investment rules & less red tape to boost investment in government chosen industries as part of the $22.7bn “FMIA” policy.
- Caps on international student arrivals by each university which can be raised if they build more student accommodation.
- Extra spending on aged care & childcare to cover wage rises.
- Freeze on deeming rates for low-income households.
Budget savings include:
- Further savings in areas like consultants, compliance and efficiencies and reducing spending on the National Disability Insurance Scheme.
Economic assumptions
The Government left its growth forecasts unchanged for this year but revised them down slightly for the next two years. Notably it has revised down slightly its inflation forecasts and still sees wages growth slowing from here as does the RBA, but an obvious risk to this is that its support for wage increases in certain industries has a flow on effect to other industries (just as the aged care wage rises last year seems to be leading to higher wages for childcare workers). It also sees lower inflation this year and next than the RBA and this is partly due to a continuation of cost-of-living relief measures that it sees as lowering measured inflation (by 0.5% in 2024-25), whereas the RBA assumed the measures lapse.
The Government now sees net immigration of 395,000 this financial year (MYEFO was 375,000), falling to 260,000 in 2024-25, taking population growth down to around 1.4% from 2.4% in 2022-23. The Government kept its medium-term iron ore price assumption at $US60/tonne. With the iron ore price well above that (>$US100 as of May 2024), it’s still a potential source of revenue upside.
Economic assumptions
| 2022-23 | 2023-24 | 2024-25 | 2025-26 | 2026-27 | 2027-28 | ||
| Real GDP | Govt | 3.1 | 1.75 | 2 | 2.25 | 2.5 | 2.75 |
| % year | AMP | 1.5 | 1.7 | 2.4 | 2.5 | 2.5 | |
| Inflation | Govt | 6.0 | 3.5 | 2.75 | 2.75 | 2.5 | 2.5 |
| % to June | AMP | 3.6 | 2.7 | 2.5 | 2.5 | 2.5 | |
| Wages | Govt | 3.7 | 4 | 3.25 | 3.25 | 3.5 | 3.5 |
| % to June | AMP | 4.1 | 3.1 | 2.8 | 3.5 | 3.75 | |
| Unemp Rate | Govt | 3.6 | 4 | 4.5 | 2.5 | 4.5 | 4.25 |
| % June | AMP | 4 | 4.4 | 4.3 | 4.25 | 4.25 | |
| Net Migration | Govt | 528,000 | 395,000 | 260,000 | 255,000 | 235,000 | 235,000 |
Source: Australian Treasury, AMP
Another budget surplus then bigger deficits
This Budget like all of those since 2020 has again benefitted from extra revenue flows coming from higher personal tax collections due to stronger jobs growth and higher commodity prices (and hence mining profits) than assumed. This is not smart management but good luck flowing from conservative forecasts. This windfall (see the line called “parameter changes” in the next table) is estimated to reduce the deficit this financial year by $10.6bn compared to last December’s update, with a total benefit over the five years shown of $12.6bn. But this table – a more detailed version of which appears in the Budget papers and is nicknamed the “table of truth” – also shows how much of the windfall has been spent (see the line called “new stimulus”). Last year only 14% of the windfall through the forward years was spent but this budget nearly twice the windfall (i.e. $24.4bn) is being spent. As a result, while the budget now looks better for this financial year (with another surplus – which could turn out to be even bigger), because of the extra spending in subsequent years it now looks worse from 2024-25.
The “table of truth” – underlying cash budget balance projections
| 2023-24 | 2024-25 | 2025-26 | 2026-27 | 2027-28 | |
| May 23-24 Budget,$bn | -13.9 | -35.1 | -36.6 | -28.5 | |
| Dec 2023 MYEFO, $bn | -1.1 | -18.8 | -35.1 | -19.5 | -26.5 |
| Parameter chgs, $bn | +10.6 | +0.0 | +2.6 | -4.0 | +3.3 |
| New stimulus, $bn | -0.2 | -9.5 | -10.3 | -3.3 | -1.2 |
| Projected budget,$bn | +9.3 | -28.3 | -42.8 | -26.7 | -24.3 |
| % GDP | +0.3 | -1.0 | -1.5 | -0.9 | -0.8 |
Source: Australian Treasury, AMP
Due to new spending & structural pressures from interest costs, the NDIS, defence, health and aged care spending as a share of GDP is expected to average 26.2% over the longer term, well above the pre-Covid average of 24.8%. Despite a blip down with tax cuts, revenue trends up reaching its 1986-87 record of 26.2% of GDP in 10 yrs. So bracket creep, not spending restraint is assumed to do the work in getting us back to a budget balance.
Federal Government spending and revenue
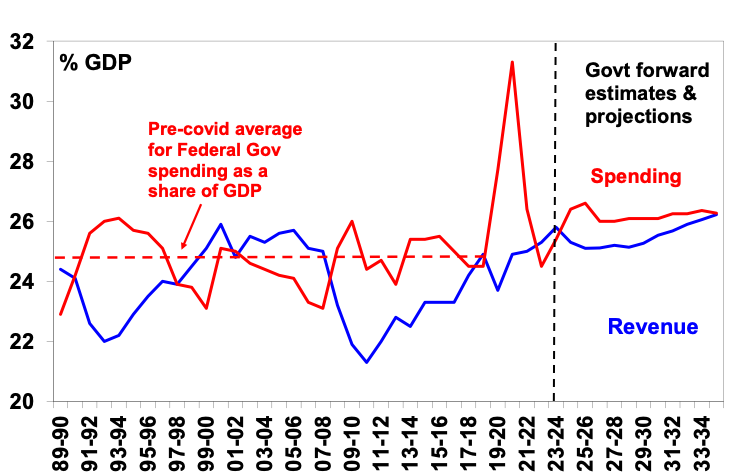
Source: Australian Treasury, AMP
After a surplus this year, there are bigger deficits over the next few years.
Australian Federal budget deficit
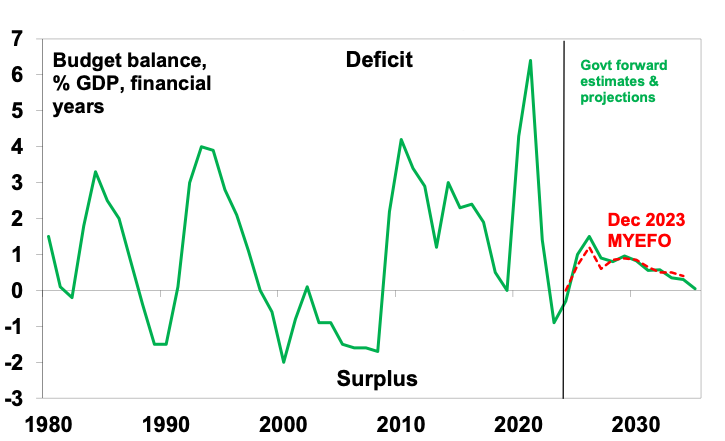
Source: Australian Treasury, AMP
Gross public debt is projected to remain elevated at around 35% GDP before falling next decade.
Winners and losers
Winners include: low and middle income households; pensioners; women; medicine users; aged & child care workers; low income renters; students; apprentices; home builders; students; defence; critical mineral projects; and clean energy manufacturers. Losers include: consultants, universities, foreign students, backpackers and dodgy NDIS providers.
Assessment
The positives in the Budget include: another surplus; the cost-of-living measures will help ease pressure on the most vulnerable and some will lower measured inflation with a second round flow on to lower indexed price rises and inflation expectations; tax breaks & streamlined approvals should help boost medium term business investment; & there is still scope for revenue to surprise with commodity price assumptions.
However, the Budget has several significant weaknesses in relation to:
- Inflation. The cost-of-living measures will help lower measured inflation. But the new stimulus (shown in the “table of truth” above) risks boosting demand. Federal and state fiscal positions point to a sharp shift from fiscal contraction (which helps lower demand and inflation) to expansion over the year ahead (see the next chart). And Government support for high wage increases for some sectors risks adding to wages growth given the flow on and influencing effects at a time when wages growth is already at its maximum level consistent with the inflation target. All of which risks making the RBA’s job harder.
Australian Fiscal Stimulus (Federal and State)
(change in budget balance estimates)
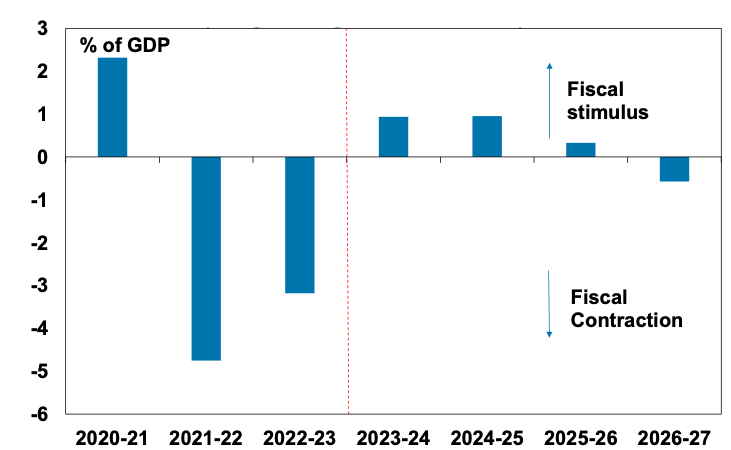
Source: Australian and state treasuries, AMP
- Structural deficits. The Budget has added to medium term structural deficits. This leaves it vulnerable if the economy weakens and sees no money put aside for a rainy day over the forecast period.
- Bigger government. Spending as a share of GDP is seen settling well above that seen pre pandemic thereby locking in a bigger government sector which risks further slowing medium term productivity growth.
- FMIA. While “made in Australia” is popular and there is talk of a “new growth” model, its reliance on protectionism and government picking winners has been tried and failed in the past with a long-term cost to productivity & living standards. Moving to net zero is one thing, but this doesn’t mean we need to make solar panels or quantum computing or that we have a comparative advantage in them. Just because other countries are deploying subsidies is no reason for Australia to do so. We should just take the subsidised products!
- Productivity. Beyond the hopes of FMIA there is not a lot here to improve Australia’s medium term productivity performance. This is the key to growth in living standards but needs urgent reform in terms of tax, competition, the non-market services sector, industrial relations, education and training and energy generation. Fortunately, the Government is moving on the last two at least.
- Housing. The latest housing measures are welcome, but are unlikely to be enough to hit the 1.2 million new homes over five years objective with the supply shortfall set to remain unless immigration plunges.
Implications for the RBA
The direct lowering in measured inflation from cost of living measures will be welcomed by the RBA, but it will be wary of the rise in new stimulus. The net effect adds to the risk of higher for longer interest rates, but is probably not enough to change our forecast for a rate cut later this year.
Implications for Australian assets
Cash and term deposits – cash and bank deposit returns have improved substantially with RBA rate hikes and the Budget won’t change this much.
Bonds – another surplus takes pressure off bond yields, but this is offset by higher medium term deficits…so there is not much in it.
Shares – the Budget is positive for spending and hence retail shares, but this may be offset by higher than otherwise rates. Some manufacturers may benefit from FMIA. Overall, it looks neutral for shares.
Property – the housing measures are unlikely to alter the home price outlook which is dominated by supply shortages & high rates. We see modest home price growth this year.
The $A – the Budget is unlikely to change the direction for the $A.
Dr Shane Oliver – Head of Investment Strategy and Chief Economist, AMP
Diana Mousina – Deputy Chief Economist, AMP
My Bui – Economist, AMP
Important note: While every care has been taken in the preparation of this document, neither National Mutual Funds Management Ltd (ABN 32 006 787 720, AFSL 234652) (NMFM), AMP Limited ABN 49 079 354 519 nor any other member of the AMP Group (AMP) makes any representations or warranties as to the accuracy or completeness of any statement in it including, without limitation, any forecasts. Past performance is not a reliable indicator of future performance. This document has been prepared for the purpose of providing general information, without taking account of any particular investor’s objectives, financial situation or needs. An investor should, before making any investment decisions, consider the appropriateness of the information in this document, and seek professional advice, having regard to the investor’s objectives, financial situation and needs. This document is solely for the use of the party to whom it is provided. This document is not intended for distribution or use in any jurisdiction where it would be contrary to applicable laws, regulations or directives and does not constitute a recommendation, offer, solicitation or invitation to invest.

Planet Wealth
- 921 High Street Rd Glen Waverley Vic 3150
- P 1300 004 254
- E info@planetwealth.com.au
- W www.planetwealth.com.au
- Facebook Planet.Insurance.Australia
- Twitter alisplanet
Planet Wealth Pty Ltd (ACN 137 467 362) as Trustee of the Planet Insurance and Financial Planning Unit Trust ABN 15 757 194 605 is an Authorised Representative and Credit Representative of AMP Financial Planning Pty Limited ABN 89 051 208 327 Australian Financial Services Licence 232706 and Australian Credit Licence 232706.
This information is provided by AMP Financial Planning Pty Limited (AMPFP) ABN 89 051 208 327 AFSL 232 706 and Charter Financial Services Limited (Charter) ABN 35 002 976 294 AFSL 234 655 Ph. 1800 021 466, both wholly owned subsidiaries of AMP and members of the AMP Group. Any advice contained in this document is of a general nature only and does not take into account the objectives, financial situation or needs of any particular person. Before making any decision, you should consider the appropriateness of the advice with regard to those matters. If you decide to purchase or vary a financial product, your advisers, AMPFP, Charter its associates and other companies within the AMP Group may receive fees and other benefits, which will be a dollar amount and/or a percentage of either the premium you pay or the value of your investments. Ask us for more details. Any general tax information provided is intended as a guide only and not to be relied upon. If you no longer wish to receive direct marketing, please call your adviser. To view our privacy policy visit AMP group privacy policy. AMP Advice is a trademark registered to AMP Limited ABN 49 079 354 519.